How Business Infographics Simplify Complex Data for Strategic Decision-Making
Business infographics have become a go-to tool for professionals who need to communicate complex information clearly and efficiently. Unlike standard reports or spreadsheets, these visual summaries combine data, text, and design elements to deliver insights at a glance. Their structured layout—often incorporating timelines, circular diagrams, and linear elements—makes them especially useful in boardrooms, presentations, and strategic planning sessions.
At their core, business infographics are designed to reduce cognitive load. By translating numbers and trends into visual formats, they help audiences grasp key points quickly. This is particularly valuable in time-sensitive environments where decision-makers need to absorb large volumes of data without getting lost in the details.
What Sets Business Infographics Apart
While charts, graphs, and dashboards all serve a purpose in data communication, business infographics offer a more integrated approach. They typically combine multiple data types—such as timelines, percentages, and flow diagrams—into a single, cohesive visual. This allows for a more comprehensive view of business performance, market trends, or strategic roadmaps.
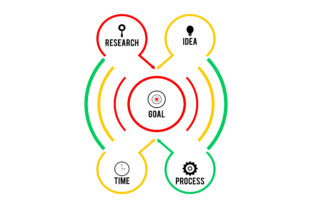
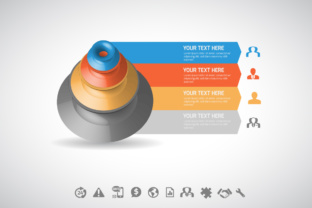
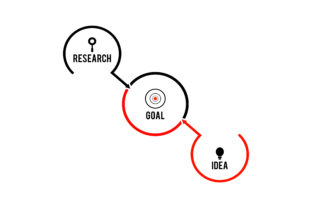
For example, a timeline with three steps can illustrate a company’s growth phases, while interconnected rings might show how different departments contribute to overall revenue. These elements are often built using vector-based tools, ensuring clarity and scalability across different formats and platforms.
Unlike static reports, business infographics can be interactive in digital formats, allowing users to drill down into specific data points. This flexibility makes them suitable for both print and online use, adapting to the needs of internal teams, clients, or public-facing communications.
Comparing Business Infographics with Other Visual Tools
When evaluating visual communication tools, it’s important to understand how business infographics stack up against alternatives like data dashboards, slide presentations, and static charts.
- Data Dashboards: Dashboards offer real-time analytics but often require technical knowledge to interpret. Business infographics, on the other hand, simplify data for broader audiences without sacrificing clarity.
- Presentation Slides: While slides can be effective for storytelling, they often require sequential navigation. Infographics consolidate key points into one view, making them ideal for quick reference.
- Standard Charts and Graphs: Charts excel at showing specific metrics, but they may not provide the full narrative. Infographics tie multiple charts together with contextual explanations and visual cues.
Each of these tools has its place, but business infographics stand out when the goal is to summarize, compare, and highlight relationships between different data sets in a visually engaging way.
When Business Infographics Are the Right Choice
Business infographics shine in scenarios where clarity and brevity are key. They’re particularly effective for:
- Presenting quarterly performance summaries to executives
- Mapping out strategic initiatives with visual timelines
- Comparing market share across competitors in a clean, digestible format
- Explaining complex processes through step-by-step visuals
For instance, a timeline with three steps can clearly show a product’s journey from development to market launch. Similarly, a ring diagram can break down departmental contributions to company-wide goals, helping stakeholders see where value is being generated.
These visuals also support internal alignment. When teams need to understand how their work fits into broader company objectives, an infographic can serve as a shared reference point that’s easy to understand and discuss.
Limitations and Considerations
Despite their advantages, business infographics aren’t always the best solution. Their effectiveness depends heavily on design quality and data accuracy. Poorly structured infographics can mislead or confuse rather than clarify.
Another potential drawback is the time and skill required to create high-quality visuals. While templates and tools can help, crafting an infographic that accurately reflects complex data often requires input from both data analysts and graphic designers.
Additionally, infographics are not ideal for deep dives into data. If the audience needs to explore granular details or perform their own analysis, a downloadable spreadsheet or interactive dashboard may be more appropriate.
Key Decision Factors
Choosing whether to use a business infographic involves weighing several factors:
- Audience: Will the intended viewers benefit from a visual summary, or do they need detailed data access?
- Complexity: Is the data best understood in isolation or as part of a broader context?
- Format: Will the infographic be used in print, digital, or interactive environments?
- Time Sensitivity: Does the audience need to make a decision quickly, or is there room for deeper exploration?
- Design Resources: Are there tools or team members available to create polished, accurate visuals?
By answering these questions early, professionals can determine whether a business infographic is the right communication tool or if another format might be more effective.
Real-World Applications and Examples
Many companies use business infographics to streamline internal reporting and external communication. For example, a marketing team might create an infographic showing campaign performance across channels, using a combination of bar graphs, pie charts, and timeline elements.
Another common use case is investor relations. Publicly traded companies often include infographics in annual reports to summarize financial highlights, strategic goals, and leadership changes in a format that’s easier to digest than pages of text.
Startups also benefit from business infographics when pitching to investors. A visually compelling timeline can show product development milestones, funding rounds, and projected growth—all in one view.
In each of these cases, the infographic serves as a bridge between raw data and actionable insights, making complex information more accessible and engaging.
Final Thoughts
Business infographics are a powerful tool for translating complex data into meaningful visuals. They offer a unique combination of clarity, engagement, and efficiency that few other formats can match. However, they are most effective when used appropriately—particularly when the goal is to inform, align, or persuade without overwhelming the audience.
Whether you're summarizing performance metrics, mapping out strategic plans, or communicating with stakeholders, a well-designed business infographic can help you deliver your message with impact. Like any tool, it’s not a one-size-fits-all solution, but when the right conditions are met, it can be an invaluable asset in your communication toolkit.