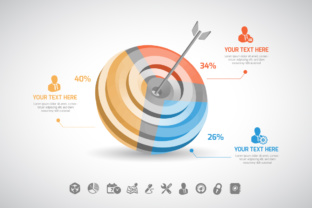
Arrow Infographic: Strategic Visual Tools for Clarity, Communication, and Execution
Visual communication plays a critical role in how we process information, make decisions, and convey complex ideas. The Arrow Infographic is a powerful visual resource designed to support professionals across industries in presenting directional data, processes, and strategic flows with clarity and impact. Unlike static images or rigid templates, this collection of fully editable vector files offers a flexible foundation for creating custom visuals that align with specific goals, branding, and messaging needs.
Each Arrow Infographic file is delivered in AI and EPS formats, making them compatible with Adobe Illustrator and other vector editing software. With 100 vector-based elements, users have the freedom to scale graphics without loss of quality, edit text, and integrate visuals seamlessly into a wide range of design projects—from print materials like posters and brochures to digital content for websites, mobile platforms, and presentations.
Why Arrow Infographics Matter for Strategic Communication
At its core, the Arrow Infographic is more than a design tool—it’s a strategic asset. Arrows are universally understood symbols that indicate direction, movement, and sequence. When used thoughtfully, they can simplify complex processes, highlight progression, and guide the viewer’s eye through a narrative or decision-making path. This makes them especially valuable in fields such as marketing, business planning, education, and operations management.
Consider how often we rely on directional cues in professional settings: flowcharts, timelines, organizational charts, and instructional diagrams all benefit from the clarity that arrows provide. The Arrow Infographic package gives users the ability to create these visuals with precision and consistency, ensuring that the message remains clear and the design remains professional.
Supporting Strategic Planning and Decision-Making
One of the most impactful uses of Arrow Infographics is in strategic planning. Whether you're outlining a product launch, mapping out a customer journey, or illustrating a business process, directional clarity is essential. Arrows help define the flow of actions, decisions, and outcomes, making it easier to communicate strategy internally and externally.
- Use arrows to show the progression of a marketing funnel
- Illustrate the steps in a decision-making process
- Visualize the stages of a project timeline
- Map out internal workflows or cross-department collaboration
By integrating these visuals into planning documents or presentations, teams can align more effectively around shared objectives and execution paths. This reduces ambiguity and supports more informed, coordinated decision-making.
Customization: The Key to Relevance and Impact
What sets the Arrow Infographic apart from generic design assets is its full editability. Every element—text, color, shape, and layout—can be adjusted to match brand guidelines, messaging tone, and specific use cases. This level of customization ensures that visuals remain relevant and consistent across different platforms and audiences.
For example, a digital marketer might use an arrow-based infographic to guide users through a landing page experience, while a teacher could adapt the same template to illustrate historical cause-and-effect relationships. The ability to scale and modify the design means that the same core visual can serve multiple purposes without losing its effectiveness.
Use Cases Across Industries and Roles
The versatility of Arrow Infographics makes them applicable across a wide range of professional and creative pursuits:
- Entrepreneurs can use them to explain business models or growth strategies in pitch decks
- Marketers can visualize customer journeys, campaign flows, or conversion paths
- Designers can integrate them into web and print layouts for enhanced visual hierarchy
- Educators can simplify complex subjects with visual sequencing
- Project managers can map out timelines and dependencies
Each of these use cases benefits from the ability to edit and repurpose the graphics, ensuring that the visuals remain aligned with evolving goals and messages.
Strategic Implementation: Planning Before Execution
While the Arrow Infographic provides a strong visual foundation, its strategic value depends on how it’s used. Like any design tool, it works best when integrated into a broader communication or planning strategy. Before diving into customization, consider the following:
- Define the objective: What message are you trying to convey? What action should the viewer take?
- Know your audience: Are they internal stakeholders, customers, or students? Adjust tone and complexity accordingly
- Map the flow: Determine the logical sequence of steps or ideas to ensure the arrow direction supports understanding
- Align with brand identity: Customize colors, fonts, and layout to match your visual identity
By answering these questions upfront, you’ll avoid the common pitfall of using visuals for decoration rather than purposeful communication.
Common Risks of Misuse
Without clear intent, even the most well-designed visuals can become cluttered or confusing. A common mistake is overloading an Arrow Infographic with too many directions, layers, or text elements, which can dilute the intended message. Another risk is using the graphics without considering the context—such as applying a formal business template to a casual blog post or vice versa.
To avoid these issues, always test your visuals with a sample audience or colleague before finalizing. Ask whether the flow is clear, the message is understood, and the design supports the intended outcome.
Long-Term Value: Beyond the One-Time Use
One of the overlooked benefits of using Arrow Infographics is their long-term utility. Because they’re built as fully editable vector files, they can be reused and updated as strategies evolve. A presentation created today can be repurposed next quarter with minimal effort, saving time and maintaining continuity in messaging.
This adaptability also supports consistent branding and communication over time. As your business or project grows, your visuals can grow with it—without the need to start from scratch each time.
Additionally, because the files are scalable and compatible with both print and digital formats, you can use the same visual assets across multiple platforms. This cross-format consistency reinforces brand recognition and improves audience retention of key messages.
Getting Started: Practical Tips for Implementation
Here are a few actionable steps to help you make the most of Arrow Infographics:
- Download and install the required fonts before opening files to ensure text displays correctly
- Experiment with different layouts to find the one that best supports your message
- Use color strategically to highlight key steps or transitions in the process
- Combine with icons or images to add context and visual interest
- Export for multiple formats—create versions for print, web, and presentation use
These small but deliberate choices can significantly enhance the effectiveness of your visuals and ensure they serve your strategic goals over time.
Conclusion: A Tool for Intentional Visual Strategy
The Arrow Infographic is more than a design resource—it's a strategic tool for anyone who needs to communicate clearly, plan effectively, and execute with precision. Whether you're crafting a presentation, mapping out a process, or simplifying complex ideas, these fully editable vector files offer the flexibility and control needed to create visuals that align with your goals.
By approaching them with intention—planning the message, understanding the audience, and designing for clarity—you can unlock their full potential. Avoid the trap of using them randomly or superficially. Instead, treat each Arrow Infographic as a deliberate part of your communication strategy, and you’ll find that your visuals not only look better but also drive better results.